My wife keeps telling me: “Honey, we’re making money more than ever, why can’t we have more financial freedom?”
I have more kids now. As they grow, they need more money, programs to keep them busy and properly educated. But aside from that, there’s the extra cost
This post is my research into the extra costs. Groceries, rent, cars, insurance. Pretty much everything.
While researching, I also looked into something slightly different: were prices already increasing at the same pace before 2020?
Did 2020 really change the trajectory?
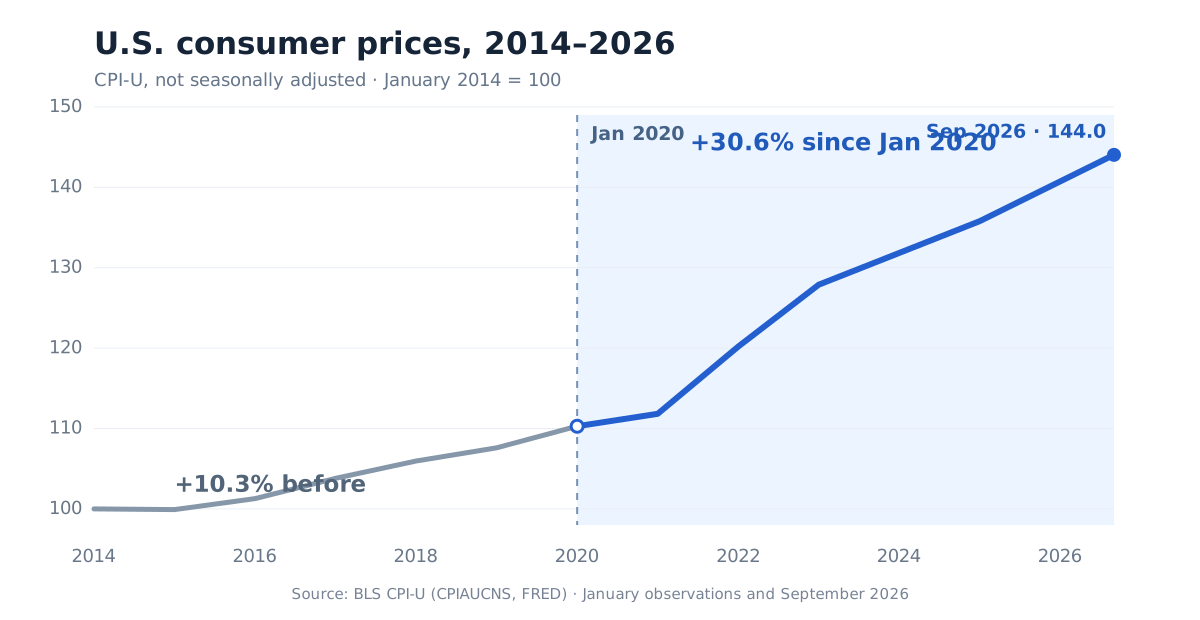
The main chart makes the difference pretty obvious.
- January 2014 → January 2020: +10.3%
- January 2020 → September 2026: +30.6%
The steepest increase came after 2020, especially through 2021 and 2022.
💡 The interesting part isn’t that prices increased. It’s how much the pace changed.
What about things we actually buy?
Overall CPI hides a lot, so I broke it down by category.
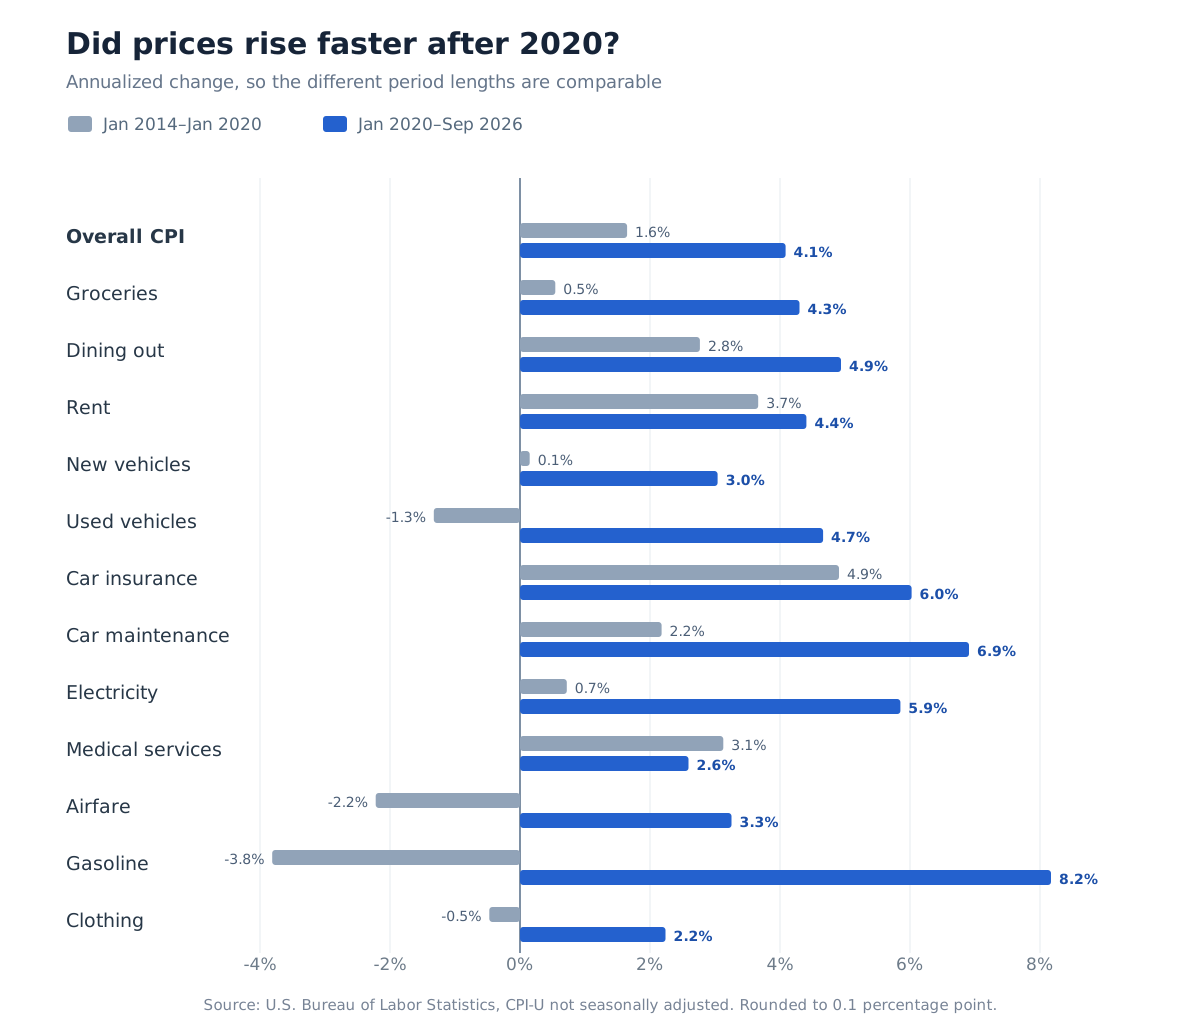
A few things stood out:
- Groceries: only +3.3% before 2020 vs +32.4% after.
- Rent: was already rising significantly before 2020.
- Car maintenance and insurance: became especially expensive after 2020.
- Gasoline and airfare: much more volatile, so endpoint comparisons are less meaningful.
One caveat: CPI shelter isn’t the same thing as home purchase prices. Buying a house is a separate affordability story.
What did everyday purchases actually cost?
Percentages are useful, but I wanted to see recognizable prices. The BLS rows below compare the same month—September—in 2014, 2020, and 2026, so seasonal food and gasoline swings do not come from comparing different times of year. The MacBook Air row uses Apple’s U.S. starting price announced during each year.
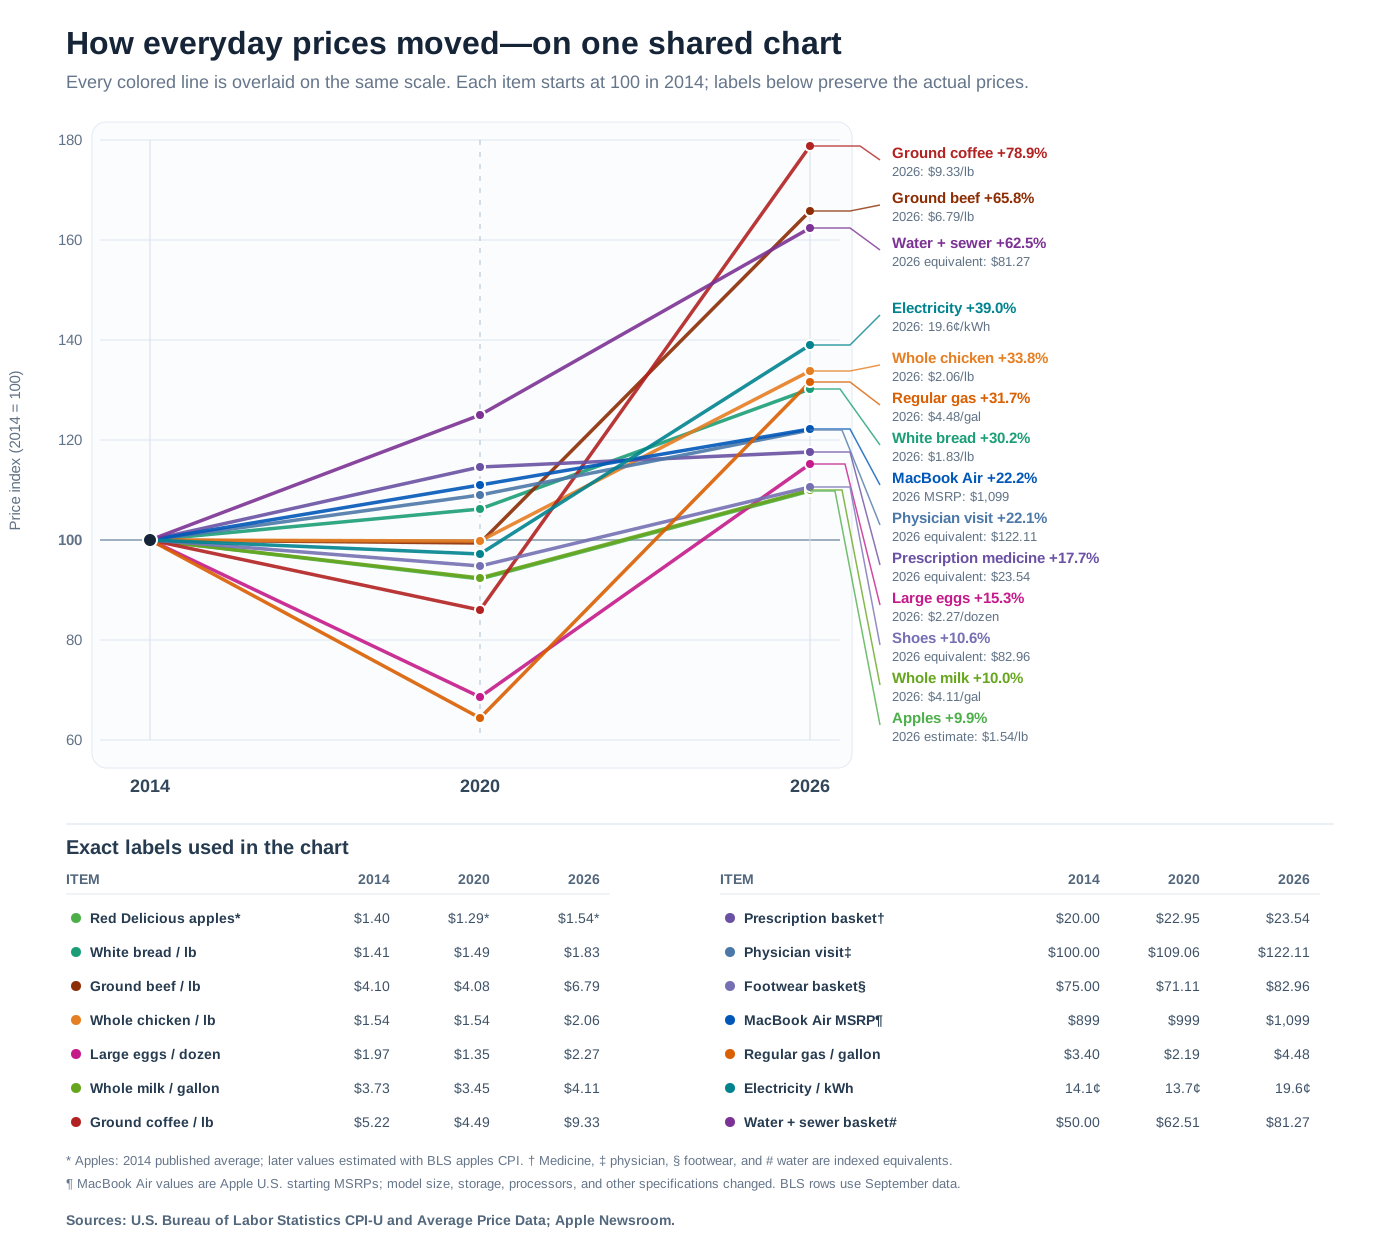
The biggest jumps in this group were coffee, ground beef, and water and sewer service:
- Ground coffee: $5.22 → $4.49 → $9.33 per pound, a 78.9% increase from 2014.
- Ground beef: $4.10 → $4.08 → $6.79 per pound, a 65.8% increase.
- Water and sewer service: a $50 service basket in 2014 became $62.51 in 2020 and $81.27 in 2026, a 62.5% increase. This is an indexed equivalent, not a claim that the average household bill is $81.27.
- Electricity: 14.1¢ → 13.7¢ → 19.6¢ per kilowatt-hour, a 39.0% increase.
- Whole chicken: $1.54 → $1.54 → $2.06 per pound, a 33.8% increase.
- Regular gasoline: $3.40 → $2.19 → $4.48 per gallon, a 31.7% increase. September 2020 sits inside the pandemic period, so it is an unusually low starting point.
- White bread: $1.41 → $1.49 → $1.83 per pound, a 30.2% increase.
- Large eggs: $1.97 → $1.35 → $2.27 per dozen, a 15.3% increase.
- Whole milk: $3.73 → $3.45 → $4.11 per gallon, a 10.0% increase.
- Physician visit: the same service costing $100 in 2014 became $109.06 in 2020 and $122.11 in 2026. BLS measures total reimbursement to the physician—not just the patient’s copay.
- Shoes: the same $75 footwear basket became $71.11 in 2020 and $82.96 in 2026.
- Apple MacBook Air: the announced U.S. starting price went from $899 in 2014 to $999 in 2020 and $1,099 in 2026. This is a real MSRP comparison, but not identical hardware: screen size, storage, processors, and other specifications changed substantially.
- Red Delicious apples: $1.40 per pound in 2014. BLS stopped publishing that exact average-price series in 2017, so the $1.29 and $1.54 figures are estimates made by applying the broader BLS apples index—not observed shelf-price averages.
- Prescription medicine: BLS does not publish one meaningful “price of medicine.” The chart therefore shows what the same prescription-drug basket would cost if it cost $20 in 2014: $22.95 in 2020 and $23.54 in 2026. This is not a typical patient’s copay: BLS tracks the total amount reimbursed to the pharmacy by the patient and eligible payers.
All fourteen colored lines are overlaid in one shared plot using 2014 = 100. That makes the direction and size of each change comparable even though a gallon of gas and a prescription do not start at the same price. The exact dollar labels are kept in the table inside the same chart.
Sources: BLS average-price series for white bread, ground beef, whole chicken, large eggs, whole milk, ground coffee, regular gasoline, and electricity; CPI series for water and sewerage maintenance, physicians’ services, footwear, apples, and prescription drugs; and Apple’s published MacBook Air starting prices for 2014, 2020, and 2026. BLS explains the item definitions in its Average Price Data guide and its medical care methodology.
If inflation is slowing, why doesn’t anything feel cheaper?
Because lower inflation doesn’t mean lower prices.
If something went from $100 to $131, then inflation falling to 2% doesn’t take it back toward $100. It just means the next increase is smaller.
💡 Lower inflation means prices are increasing more slowly. It does NOT mean prices are returning to where they were.
How much did wages rise?
For wages, I used the BLS Employment Cost Index (ECI) rather than median earnings.
ECI basically answers: “How much more are employers paying for the same kinds of jobs than they were before?”
That’s useful because a normal average or median salary can change just because the workforce changes. In 2020, many lower-paid workers temporarily lost their jobs, which could make the remaining workers’ median salary look higher even without everyone getting raises. ECI tries to remove that effect.
For this section I use two equal six-year windows:
September 2014 → September 2020 → September 2026
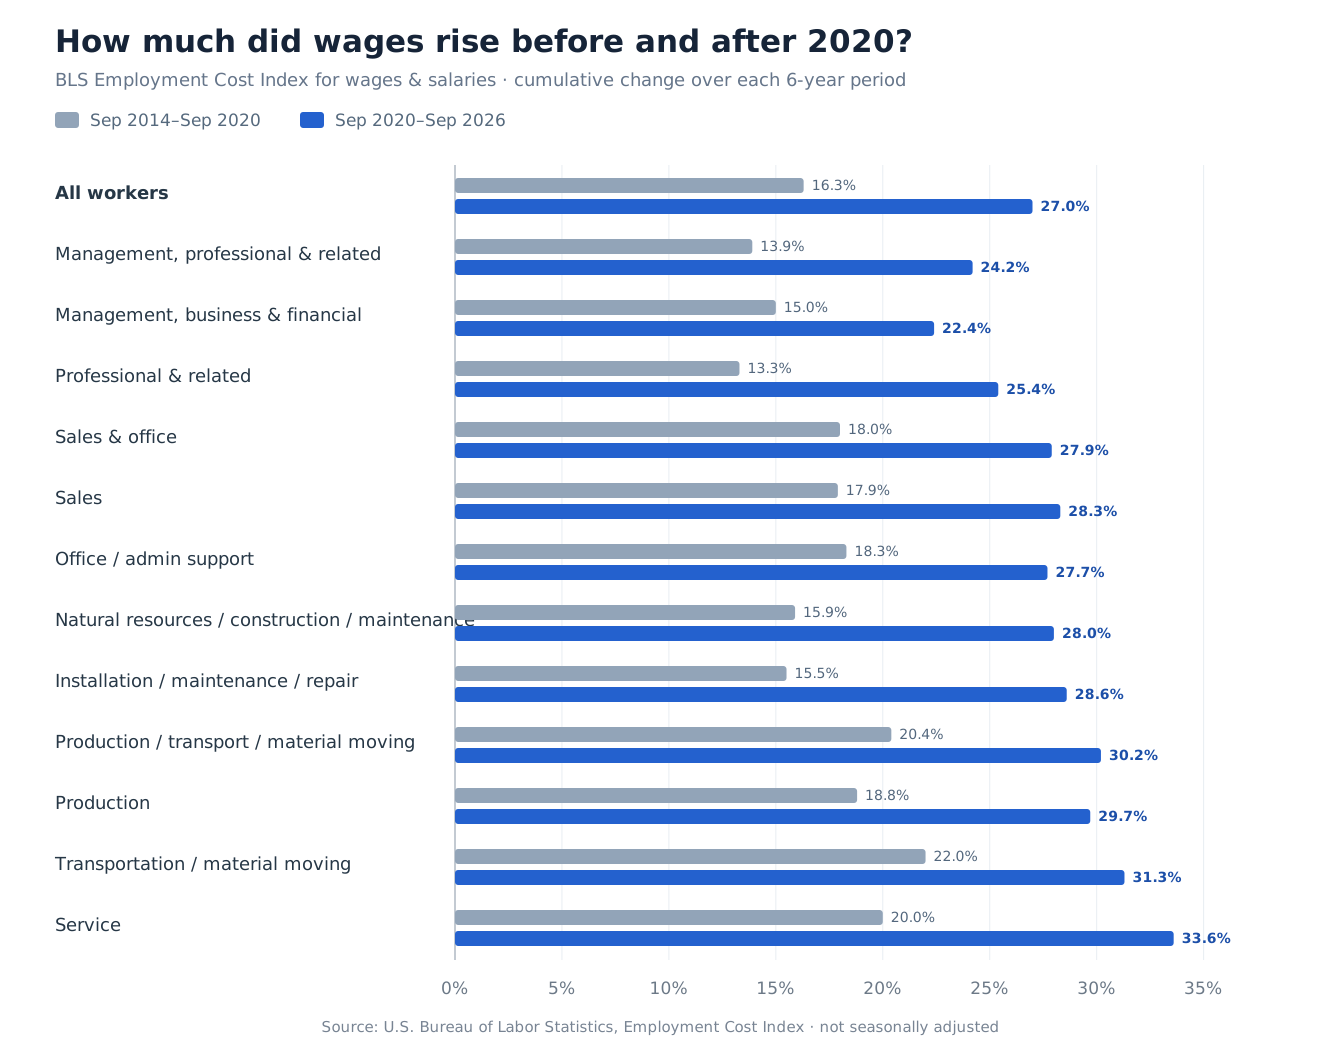
Wages rose faster after 2020 across almost every occupational group.
But wage growth by itself doesn’t tell us whether people were actually better off.
Did wages actually keep up with prices?
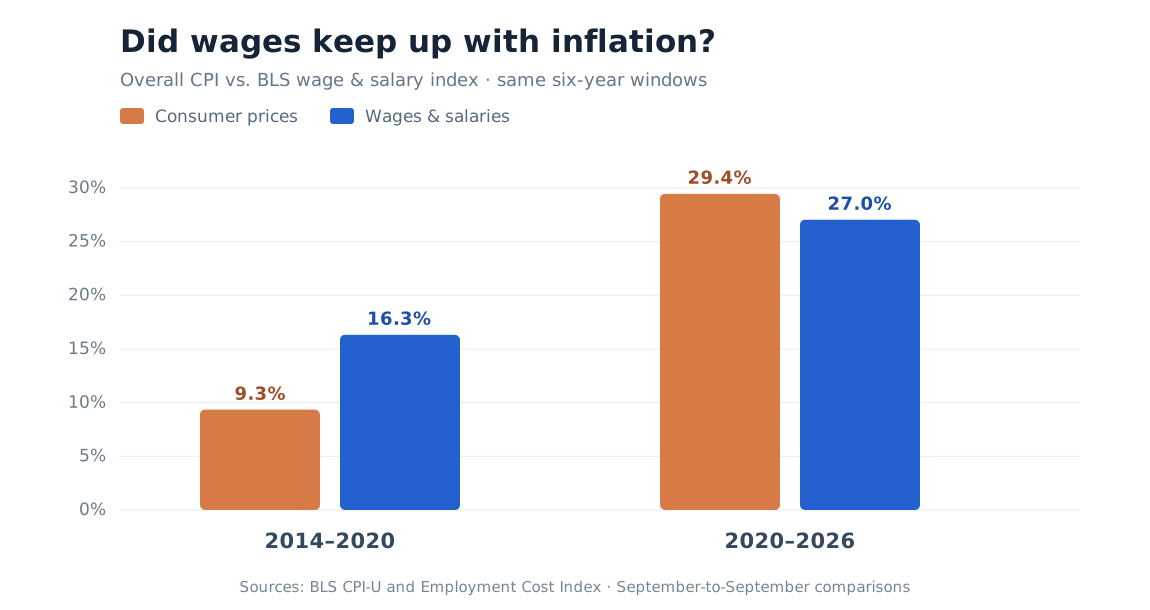
This is probably the most important chart in the post.
2014–2020
- Prices: +9.3%
- Wages: +16.3%
2020–2026
- Prices: +29.5%
- Wages: +27.0%
Before 2020, wages clearly outpaced inflation.
After 2020, overall prices slightly outpaced wages.
And that’s using overall CPI. If more of your budget goes toward groceries, rent, electricity, car insurance, or maintenance, your personal experience may feel worse than the headline number suggests.
TLDR
If your salary in 2020 was 100k and you’re making 129.5k now,
If your salary in 2020 was 200k and you’re making 259k now:Then it means you have had zero raise in your quality of life. 🫤🫤🫤
References
- Consumer Price Index, September 2026 - BLS
- Consumer Price Index, January 2020 - BLS
- Consumer Price Index, January 2014 - BLS
- CPI-U: All Items, Not Seasonally Adjusted - FRED/BLS
- BLS Average Price Data: methodology and item definitions
- BLS average price: white bread, per pound
- BLS average price: ground beef, per pound
- BLS average price: whole chicken, per pound
- BLS average price: large eggs, per dozen
- BLS average price: whole milk, per gallon
- BLS average price: ground coffee, per pound
- BLS average price: regular gasoline, per gallon
- BLS average price: electricity, per kilowatt-hour
- BLS CPI-U: water and sewerage maintenance
- BLS CPI-U: physicians’ services
- BLS CPI-U: footwear
- BLS CPI-U: apples
- BLS CPI-U: prescription drugs
- BLS medical care methodology
- Apple: MacBook Air starting price, 2014
- Apple: MacBook Air starting price, 2020
- Apple: MacBook Air starting price, 2026
- Employment Cost Index, September 2014 - BLS
- Employment Cost Index, September 2020 - BLS
- Employment Cost Index, September 2026 - BLS
Method: Price data uses US CPI-U, not seasonally adjusted. Wage data uses the BLS Employment Cost Index for wages and salaries. Wage comparisons use September 2014, September 2020, and September 2026 so both periods are exactly six years. Percentages are rounded.